WDG Consulting, LLC DeltaTrax

DT-Empirical Blend v2 · DT-Doppler · Oct 24, 2026 · Maine to Florida

The flyway,
decoded.

Where Atlantic Flyway ducks are born, where they spend the winter, how that has changed since 1955 and where they're headed next. 2.4 million banding records, 72 years of breeding surveys, 52 years of Delaware flights, blind-by-blind refuge results, South Carolina's harvest and duck-food census, 1.8 million hours of weather and a fresh satellite read, lined up side by side for the first time we know of. Things duck hunters have said for generations, like "a hard freeze up north brings birds," now have numbers behind them, and now a model that reads them every morning.

4,388,958public records in the DeltaTrax data pool, counted row by row
2,419,194USGS duck banding and recovery records, 1960–2024
1,816,722hours of airport weather, plus 148,734 days of snow and river readings
72years of May breeding surveys, 1955–2026

Sources: USGS Bird Banding Laboratory, SCDNR, IEM ASOS, NOAA NCEI, USGS NWIS, Copernicus Sentinel-2

Oct 24, 2026 edition · the evidence, all in one place

Seventy-two years of the Atlantic Flyway, lined up side by side.

Banding crews, May survey pilots, refuge blind sheets, state aerial counts, check stations, satellites and seven decades of field papers. Each one has been studied alone. As far as we can find, nobody has put them all side by side before. Every number on this wall is counted from the original record, and the lab's own compilations are marked.

2,419,194USGS banding and recovery records, 1960–2024Checked
72years of May breeding surveys, 1955–2026Checked
2,173Delaware aerial zone flights, 1974–2026Checked
1,913Mattamuskeet blind hunters across 16 blinds, 2021–2024Checked
26,653,912Waterfowl Energy Days measured on SC public land, fall 2024Checked
12,771ducks in five seasons of SC WMA bagsChecked
28,311summer-banded recoveries traced back to where 18 species were bornLab compilation
74managed WMA and refuge units, Florida to Maine, 646,809 acresLab compilation
43 · 23hypotheses and multi-region cross-tests in the DeltaTrax labLab compilation

The one-minute version

Five forces reshaped where ducks spend the winter.

They don't act alone. Warmer winters, food, water and habitat loss interact, and together they decide which ducks reach the Carolinas, where they sit and when they move.

Interactive timeline

Watch 65 years of ducks move.

Swipe the chart to change decades. Each dot is the average latitude where that species' bands were recovered? in the 16 Eastern states and DC. Press play. Mallards drift north while Wood Ducks, Redheads and teal slide south toward the Carolinas.

How to read this: each line is the center point of a species’ band recoveries in the 16 Eastern states and DC. It’s the average latitude of every recovery that decade, so it shows which way the whole population is shifting, not how far south it reaches. Plenty of these ducks are shot in South Carolina: 27.2% of Wood Duck recoveries now come from SC alone. The flyway map below shows how much of each group lands in each state. City names mark latitude only. Data: USGS Bird Banding Laboratory, 2,419,194 records.
1960sbaseline decade
12.82% of Eastern Mallard recoveries were in South Carolina
39.60°N average Mallard recovery latitude

    The flyway map · 31°N to 45°N

    Four stepping stones, and where each kind of duck stops.

    Ducks come down the coast in stages: New York to New England, the Chesapeake and Delaware Bays, North Carolina's sounds, then South Carolina and Georgia. Pick a duck group and slide through the decades, or switch to the season view to watch a typical hunting season, mid-November to the end of January, play out.

    1960sMallard & Black Duck
    –North Carolina share
    –South Carolina share
    –average recovery latitude

    Circles show each region's share? of that group's band recoveries in the 16 Eastern states and DC. Regions: Northeast = NY, PA, NJ and New England; Mid-Atlantic = DE, MD, DC, VA, WV. Season view: 24,933 hunter-reported band recoveries from November 16 to January 31, in five half-month steps, January 2017 through January 2024. October and February are left out because most Carolina seasons are closed then, and a closed season reports no ducks. Recoveries show where ducks were shot and reported, not a headcount. Data: USGS Bird Banding Laboratory.

    44.1%of Gadwall, Wigeon and Shoveler recoveries are now in North Carolina, up from 14.2% in the 1960s. South Carolina's share fell from 18.7% to 3.9%.
    33.5%of teal recoveries are now in North Carolina, up from 17.4%. South Carolina held flat at about 12%.
    27.2% + 23.7%of Wood Duck recoveries are now in South Carolina and Georgia. They are the one group that grew in SC.

    Flow view · every band report

    Every band report, replayed week by week.

    Each glowing dot is a spot where hunters reported banded ducks that week, summed across every season from 2017 to 2024. The color shows which duck group was reported most there. Watch the Carolinas light up as the season goes on.

    Nov 16–22

    24,933 hunter-reported band recoveries, November 16 to January 31, January 2017 through January 2024, placed on a quarter-degree grid (about 15 miles). Dot size = number of reports in that cell that week. The early-December dip in North Carolina is the split-season break, not ducks leaving. Data: USGS Bird Banding Laboratory.

    Homing ducks vs. first-autumn ducks · 39,226 linked band pairs, 2014–2024

    A lot of South Carolina's ducks come home. The new ones fly the farthest.

    A linked pair ties the spot where a duck was banded to the spot where it was later shot and reported. 6,472 of these pairs ended in South Carolina, and they change how to read the band maps above. They also back up something hunters have always said: the same birds come back to the same marsh, and the young birds are the ones that push south first.

    Why band maps undersell the marsh ducks

    Share of the SC WMA bagShare of SC + NC band pairs
    Gadwall, shoveler, pintail and wigeon are 36.0% of the five-season SC WMA bag (12,771 ducks), yet only 232 of these 12,589 band pairs. Wood Ducks are 7.7% of the bag and 75.5% of the pairs, because crews band them by the thousands in summer. Band pairs among the 13 species with SC + NC recoveries. Sources: DeltaTrax linked-pair file built from the USGS Bird Banding Laboratory; WMA bag from SCDNR.
    29.0%of the ducks recovered in South Carolina were banded in South Carolina, the #1 origin by far. Add North Carolina and Georgia and it's 31.9%.
    36.0%of the SC WMA bag is gadwall, shoveler, pintail and wigeon, the migratory marsh ducks that rarely get banded in the Atlantic Flyway.

    So when a band map shows only a sliver of these birds in South Carolina, it's partly a banding gap, not an empty marsh.

    Where South Carolina-banded ducks spend later winters

    Banded in summer · local Wood Ducks and Mottled Ducks · 1,189 birds

    82.4%recovered back in South Carolina in a later season
    South Carolina 82.4%Elsewhere 17.6%

    Banded after the season, January to March · Santee Coastal, ACE Basin, Yawkey · 92 birds

    56.5%came back to winter in South Carolina. The rest moved one step, not at random.
    SC 56.5%Georgia, Savannah–Altamaha 19.6%Coastal NC 12.0%Chesapeake & Mid-Atlantic 12.0%

    The winter-banded group is only 92 birds, so treat its splits as a strong lead rather than a precise rate.

    First-autumn ducks vs. veterans

    Of 15,379 ducks banded at 38°N or farther north and recovered between November and January, the first-autumn birds (recovered the same season they were banded, 4,953 of them) were shot an average of 0.66° farther south, about 46 miles, than veterans recovered two or more winters later (10,426). That gap is far too large to be luck (Welch's t-test, p = 3.8×10⁻²⁵?).

    The likely reason: veteran ducks know the northern sanctuaries and flooded grain, like Montezuma, Bombay Hook, the Eastern Shore and Mattamuskeet, and they hold there unless a hard freeze locks them out. Young birds don't know those spots yet, so early fronts and opening-week pressure push them farther. That's why so many of the first big pushes into South Carolina are young ducks.

    Species by species, it's mixed. Wigeon (+0.39°) and Ring-necked Ducks (+0.23°) hold farther north as veterans. Green-winged Teal (−0.78°) and Pintail (−2.23°, only 67 birds) go the other way. Part of the overall gap may come from which species are in each group, so a later release will split it species by species.

    Where they're shot, on average

    19.1%of first-autumn ducks reached South Carolina
    15.0%of veterans did, 21.5% fewer
    Northern-banded ducks (banded at 38°N or north), recovered Nov–Jan, 2014–2024. City names mark latitude only. Source: DeltaTrax linked-pair file, USGS BBL.

    Veteran vs. first-autumn latitude, species by species

    First autumnVeteran, 2+ winters
    Northern-banded birds among each species' SC + NC band pairs. Arrows point from first-autumn to veteran average. Pairs = that species' SC + NC linked recoveries. Mottled Ducks are resident and not shown. Small samples (under 100 pairs) are faded. Source: Flyway Model v1 fidelity table.

    What makes a homing duck switch marshes

    01The food or water fails

    A dike breach or salt water over 25 ppt kills the wigeongrass, or the trunk is still drawn down when the birds get back. Returning adults leave within days for an intact impoundment, or slide 30 to 75 miles south to the Savannah and Altamaha deltas.

    02Pressure without rest

    Homing adults put up with draw hunts about one day a week. Santee Coastal averaged 3.94 birds per hunter that way. More than two straight days of boats and gunning pushes them onto refuges and private sanctuaries.

    03Split-season flooding

    Managers flood moist-soil units first, in October and November, and hold corn dry for the second split. Birds shift within the same basin as each unit comes up. See how trunks work.

    04Short-stopping, one winter at a time

    A first-autumn bird that gets through a mild Mid-Atlantic or North Carolina winter tends to come back there as a veteran instead of flying on to South Carolina.

    The band pairs show where homing ducks go. The four reasons are how managers and biologists explain those moves. DeltaTrax hasn't tested each one on its own yet.

    The breeding grounds · 1955–2026

    The spring count held steady. Mallards didn't.

    Every May since 1955, U.S. and Canadian crews have flown the same survey lines from the Dakotas to Alaska. This is the May survey?. In 2026 they estimated 33.4 million breeding ducks, 6% below the long-term average. Mallards fell 11% to 5.86 million, the lowest count since 1993.

    Breeding ducks, traditional survey area, millions

    202633.4M6% below average
    Each point is one May survey. Dashed line = 1955–2024 average. There was no survey in 2020 or 2021. The traditional survey area covers Alaska, central and western Canada and the north-central U.S., not the eastern breeding grounds. Sources: USFWS Waterfowl Population Status, 2025 and Ducks Unlimited, 2026 survey results. The yearly values come from the DeltaTrax lab's survey file, checked against both.
    33.4Mbreeding ducks, May 2026, 6% below average
    5.86Mmallards, 26% below average and the lowest since 1993
    ~89%of eastern mallards sampled were wild × game-farm hybrids

    Fewer mallards, and fewer truly wild ones

    A 2025 study of eastern mallards found about 89% carried game-farm? ancestry. It also found nearly half the birds caught at summer banding sites had hatched or molted farther north, so where a mallard is banded doesn't show where it hatched (Harvey, Schummer, Lavretsky et al., Journal of Wildlife Management). Mallards are already only 2.5% of the South Carolina WMA bag.

    The ducks that carry Carolina hunting lean on eastern and boreal breeding grounds this survey doesn't fly (see Homing). Those held up better in 2026: eastern breeding habitat supported stable duck numbers, eastern mallards dipped only slightly, and Black Ducks stayed above their average (Ducks Unlimited, North Atlantic migration alert).

    Where they're born · 3D globe · now with October 2026

    The farther south you hunt, the farther your ducks came from.

    The lab traced summer-banded ducks back to where they were raised. Maine's ducks are mostly local and eastern boreal birds. Head south and the prairie share climbs state after state. In Georgia and Florida, most ducks in the bag were raised in the prairies, the western boreal, the Great Lakes or James Bay. Press play and fly the coast.

    65%

    • Prairies & W. boreal
    • Great Lakes & Mississippi
    • Ontario & James Bay
    • Eastern boreal
    • Local
    Lab estimate · re-run pending
    Arc width = share of each state's band returns that trace to that breeding region. Lab estimate built from 28,311 summer-banded USGS recoveries, feather isotopes and published DNA work. Banding effort is uneven across regions, so read this as direction and rough size, not an exact census. Canvasback view: May 2026 breeding estimates by survey region from the USFWS 2026 Waterfowl Population Status report, Table 11. The fall stopover is the Upper Mississippi's Pools 7–9, up to 400,000 canvasbacks (DU, quoting USFWS). The winter counts are Maryland's 2026 midwinter survey and Catahoula Lake, January 2004 (DU). The towers mix seasons on purpose: breeding, stopover and winter. October 2026 view: 423 geolocated Anatidae records from GBIF.org, each one released by its observer under CC0 or CC BY 4.0, drawn from iNaturalist research-grade observations and the Birda global observation dataset. Sightings show where people looked and reported, not how many ducks are out there. Tracks: English et al., American black duck PTT data from Atlantic Canada (Dryad, CC0), monthly fixes picked by the lab.

    Interior-born share, Maine to Florida

    Prairies, western boreal, Great Lakes and James Bay combined. Tap a state to fly the globe there. Lab estimate.

    Where each species is raised

    Share of each species' summer-banded recoveries by breeding region. Lab estimate from USGS band data, isotopes and DNA. Mottled Ducks and Wood Ducks are almost all raised locally. Canvasbacks, Redheads and scaup come from the far interior.

    The canvasback pivot · 1955–2026

    Canvasbacks didn't disappear. They moved to where the food went.

    In January 1955, survey crews counted 225,450 canvasbacks in Maryland's Chesapeake Bay. In January 2026 they counted 25,300, down 89%. Over the same years the continent's breeding canvasbacks went from 589,300 to 781,600. The birds are fine. The Bay's food isn't what it was.

    Maryland, Jan 1955
    225,450
    Maryland, Jan 2026
    25,300
    Breeding, May 1955
    589,300
    Breeding, May 2026
    781,600

    1972: the storm that changed the menu

    In June 1972, Tropical Storm Agnes dumped record rain on the Chesapeake watershed. The sediment and nutrients that followed cut the Bay's underwater grasses by about two-thirds (Lynch, Chesapeake Research Consortium). It wiped out the Susquehanna Flats beds and the waterfowl with them (Orth et al. 2017, BioScience). Wild celery tubers had been the canvasback's main winter food. Without them, Bay canvasbacks switched to Baltic clams and corn (Haramis et al. 2001, The Auk).

    Clams are a poor substitute. In feeding trials, canvasbacks on wild celery tubers gained 32 g a day. On clams they gained 23 g, even though they ate almost twice as much food by weight (Jorde et al. 1995, Journal of Wildlife Management).

    Canvasback weight gain by diet, grams per day

    Average daily gain after a fast, captive canvasbacks, by diet. The clam-fed birds ate 2,169 g a day, against 1,158 g of tubers. Source: Jorde, Haramis, Bunck and Pendleton 1995.

    Where today's canvasbacks are

    • Breeding: South Saskatchewan alone held 234,000 in May 2026. The eastern Dakotas held 89,000, almost double their average.
    • Fall stopover: the Upper Mississippi's Pools 7–9, which can hold up to 400,000 in some years.
    • Winter: Gulf Coast marshes and Louisiana's Catahoula Lake, which held about 123,000 in January 2004.
    • Coming back east: the Susquehanna Flats grass beds have regrown since the early 2000s and may be nearing historic levels (Orth et al. 2017).

    Sources: USFWS 2026 Waterfowl Population Status, Table 11, and MD DNR 2026 midwinter survey. The 1955 Maryland count is from the MD DNR series, reported in Oceanography (Dybas 2018). The lab's version of this story isn't used. Its "21.5× worse cold-stress loss" comes from a secondhand summary, while the original paper found weight loss during fasting did not differ by diet. Its exact shares for each wintering site also mix fall and winter counts.

    The canvasback's year, on one map

    BreedingFall stopoverWinterMaryland, January 1955
    Circles are sized to the count. The dashed ring around the Chesapeake is Maryland's January 1955 count, 225,450, against 25,300 today, the same numbers as the bars above. Arcs show the general direction of travel, not tracked birds. Sources: USFWS 2026 Waterfowl Population Status, Table 11 (breeding); the stopover, Catahoula and Susquehanna Flats sources listed below.

    Force 01 · Climate × Mid-Atlantic corn

    The Mallards stopped coming this far south.

    Ducks only fly farther south when staying put costs more than the trip. The study's explanation: as Mid-Atlantic winters warmed and freeze-ups shortened, flooded and unharvested corn from New York to Virginia stayed open longer, so Mallards had less reason to keep going to the Carolinas.

    91.9%drop in South Carolina's share of Eastern Mallard recoveries, 1960s to 2020s
    ~100 minorthward shift in average Mallard recovery latitude (39.60°N → 41.04°N)
    79.6%drop in South Carolina's Black Duck share, while the Mid-Atlantic share rose from 59.6% to 76.1%

    Based on 142,988 Eastern Mallard and 63,353 Black Duck encounters (USGS BBL). It's not just the Carolinas: a separate USGS, Ducks Unlimited and USFWS study of 350,000+ band recoveries in the Central and Mississippi flyways found Mallard and Pintail winter ranges shifted north and east since the 1960s (USGS, 2024; Ecology and Evolution).

    South Carolina's share of Eastern recoveries

    Share of all recoveries in the 16 Eastern states and DC that occurred in SC. 2020s = 2020–2024. Hover a bar for counts.

    South Atlantic share (SC + NC + GA), 1960s → 2020s

    Hollow dot = 1960s, filled dot = 2020s. Small sample marks fewer than 250 recoveries in the 2020s, so treat those swings with care. Source: USGS BBL.

    Force 02 · The great divergence

    The ducks that can't eat frozen corn now carry Carolina hunting.

    Big-bodied Mallards can ride out a cold snap on corn. Teal and the grass-and-bug specialists (Gadwall, Wigeon, Pintail, Shoveler, Ring-necked Duck, Redhead) depend on shallow open water, wigeongrass, native seeds and invertebrates, and those habitats are what the Carolinas still have.

    37.8% → 46.8–51.9%Green-winged Teal South Atlantic share, 1960s to 2010s–2020s
    48.5% → 71.5%Wood Duck South Atlantic share

    Those two became the backbone of Carolina duck hunting. Redheads made the biggest swing: from 1.1% to 67.9% South Atlantic, with North Carolina alone at 60.5% in the 2020s.

    One correction to the earlier story: for most migrants, the southern gain landed in North Carolina, not South Carolina. The flyway map shows it region by region.

    Force 03 · Managed brackish marsh vs. open-water collapse

    Old rice fields, run right, are still the best duck habitat in the state.

    Where 18th- and 19th-century tidal rice fields still have working water-control trunks and brackish water for wigeongrass, ducks stay. Santee Coastal Reserve (Murphy Island, Cedar Island and The Cape) leads every habitat type in the SCDNR records.

    3.94birds per hunter at Santee Coastal Reserve: 5,796 birds from 1,472 reported hunters, 2021–22 to 2024–25
    4.53shots per bird, the best of any habitat type with more than 150 hunters

    This season, 2026–27: Cedar Island is closed for dike and trunk renovation, per SCDNR's waterfowl lottery page. Murphy Island and The Cape stay open on the lottery draw (2026–27 hunt dates). The 3.94 average above covers all three units, 2021–22 to 2024–25.

    The bag there is migratory. Green-winged Teal made up 30.8% across four seasons; in 2024–25, Pintail and Shoveler were 27.3% and Gadwall and Wigeon 25.5%. Mallards and Black Ducks were just 1.4% (SCDNR Waterfowl Archive). The 2024–25 totals match SCDNR's official season summary exactly.

    Five SC seasons by habitat type

    Higher is better. Pooled totals, 2021–22 through 2024–25. "Birds" is SCDNR's total harvest. Source: SCDNR Waterfowl Archive and SCDNR public harvest records.

    Same rivers, same kind of old rice field, two very different bags

    All six units sit in the old Santee and Pee Dee rice-field country, and SCDNR runs every one. On Santee Coastal Reserve's Murphy Island and The Cape, about half the bag was Pintail, Wigeon and Gadwall, the ducks that feed on wigeongrass and other underwater plants. At Santee Delta West and Samworth, 1 duck out of 178 was one of those three. The bag there was mostly Wood Ducks, which are swamp and creek birds.

    The lab ties the difference to failed dikes and reed takeover upriver. The bag mix fits that, but these records show the birds, not the dikes, so we haven't confirmed dike condition unit by unit. Cedar Island is closed this season (2026–27) for dike and trunk work.

    What hunters brought home, 2024–25 and 2025–26

    Pintail, Wigeon, GadwallTealShovelerWood DuckOther
    Share of all ducks reported, by unit, with ducks per hunter on the right. Labels show the Pintail, Wigeon and Gadwall share. Two seasons of dated SCDNR hunt reports. Source: SCDNR public harvest records.
    80–120kAcres planted in rice in South Carolina at the pre–Civil War peak, on dikes, canals and trunks built by enslaved Africans (South Carolina Encyclopedia; JAWRA, 2026).
    ~70kAcres of old tidal impoundments still managed today, mostly for ducks, after hunting clubs and later refuges took over the fields in the early 1900s (S.C. Sea Grant).
    2 in 3Acres of Georgetown County's tidal rice fields that are now broken: about 32,000 broken vs. 15,700 still working, as of 2021 (JAWRA, 2026, citing Hanks et al. 2021).

    Two plant regimes · why so many ducks were lost, and why they moved

    When one plant takes over a whole system, the ducks follow it in, or leave.

    Ducks winter where the food is. Twice in living memory a single plant flipped an entire system, and the birds moved with it. On the Santee lakes it was hydrilla, a food plant that came and went in a decade. On the Atlantic coast it's Phragmites, a tall reed that crowds out the marsh plants ducks eat and hasn't stopped spreading.

    Hydrilla · Lakes Marion and Moultrie, S.C.

    17,272 hapeak, 1994~0by 1997, after 768,500 grass carp
    45.74%SC's share of Eastern Ring-neck recoveries, 1990s22.78%2000s

    A food boom pulled Ring-necked Ducks south to the Santee lakes. When the grass went, half of them stopped coming. The chart below shows it decade by decade.

    Phragmites · Atlantic tidal marsh, New England to S.C.

    Monoculturetall, dense reedNative foods outbulrush, cordgrass, wigeongrass edges
    22,050ducks per Prime Hook flight, 1988–2005, behind dikes built partly to keep reed out6,798since the 2016 return to tidal marsh

    The Smithsonian calls the reed's spread the single largest change in Chesapeake Bay wetlands, and Connecticut marshes taken over by it held fewer Mallards and Black Ducks (SERC, citing Benoit et al. 1999). The Atlantic Coast Joint Venture says it "dramatically lowers the habitat value for Black Duck" and needs managing as far south as South Carolina (ACJV Black Duck plan). Yawkey sprayed 419 acres of it in 2021–23 to keep its impoundments open (Yawkey biennial report).

    Both regimes line up with where the birds went, not proof of the only cause. Hydrilla is the cleaner test, because it came and went fast on one lake system. Prime Hook's 52 winters are just below.

    The Santee Cooper boom and crash, captured in the band data

    Hydrilla invaded Lakes Marion and Moultrie during the 1980s and peaked at 17,272 ha in 1994. 768,500 sterile grass carp stocked from 1989 to 1996 wiped out the underwater vegetation by 1997 (Kirk & Socha, Journal of Aquatic Plant Management). Ring-necked Ducks followed the grass: South Carolina's share of Eastern recoveries spiked to 45.74% in the 1990s, then halved to 22.78% in the 2000s.

    Ring-necked Duck, SC share of Eastern recoveries. Source: USGS BBL.

    Prime Hook NWR, Delaware · Zone 7 · 52 winters from the air

    In 1988, Prime Hook put in dikes. Ducks went up more than seven-fold.

    Prime Hook was tidal salt marsh until 1988, when the refuge closed off about 4,000 acres behind water-control structures and ran them as freshwater impoundments? growing wild rice, millet and beggar's-tick for wintering ducks (USFWS 2010 draft EA; USFWS, Changing Wetlands). Delaware's survey plane saw what happened next. In Zone 7, the average November–January flight went from about 3,000 ducks to about 22,000. Pintails went from 145 a flight to 5,358. Green-winged Teal went from 586 to 10,916.

    Then the sea came back. Storms breached the dunes from 2006 on, Hurricane Sandy finished the job in 2012, and in 2016 a $38 million project rebuilt the beach and turned the units back into tidal salt marsh. The water-control structures came out (USFWS; Cape Gazette). Since then it has averaged about 6,800 ducks a flight, and pintails are back to pre-dike levels.
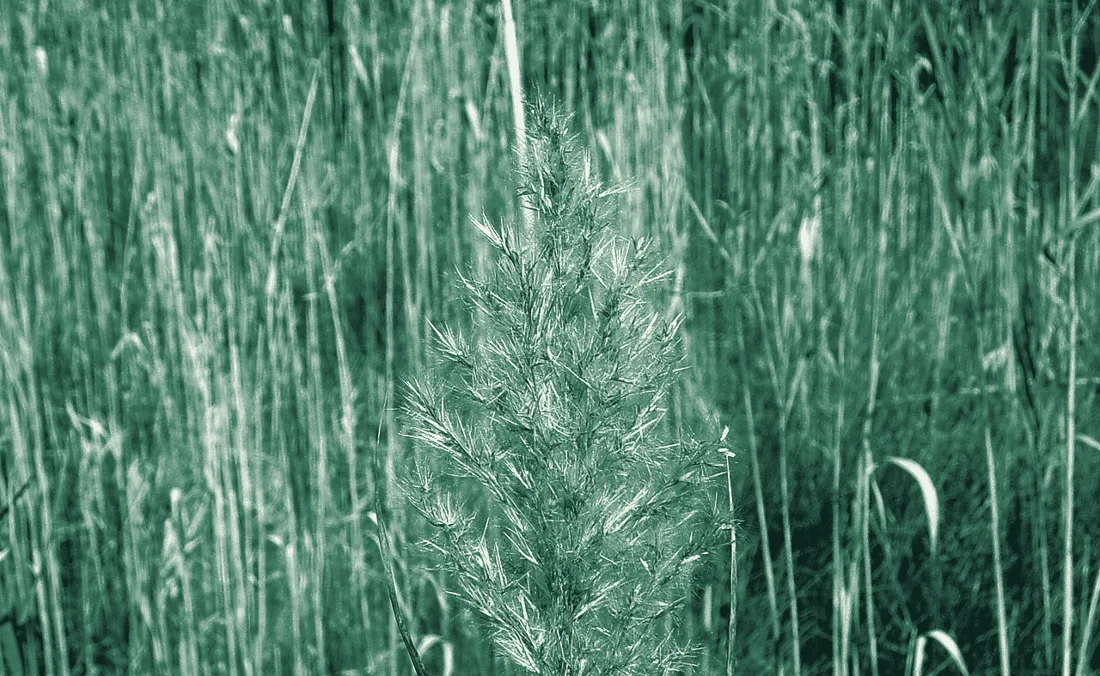
    Tall stand of common reed, Phragmites australis, with a seed head in front
    Common reed (Phragmites). Keeping it out was one of the reasons for the 1980s impoundments (Cape Gazette timeline). Photo: Rlevse, Oceana Pond, Virginia Beach, 2007, public domain via Wikimedia Commons.

    Ducks per flight, November–January

    Zone 7 · Prime HookZone 5 · Bombay Hook, for comparison
    Each point is one winter's average flight (November, December, January), with duck species added up and geese, swans and coots left out. Zone 7 runs from Big Stone Beach to the Broadkill River, which takes in Prime Hook. Zone 5 runs from Smyrna to Port Mahon, which takes in Bombay Hook (DNREC zone map). From 2010 to 2019 DNREC flew twice a month, so those winters average more flights. Source: DNREC aerial survey file, all 2,173 rows.
    7.4×Prime Hook's jump once the 1988 dikes went in. Bombay Hook's zone rose 28% over the same years.
    −62%Bombay Hook's zone, 1988–2005 vs. 2016–2025. It kept its freshwater pools (Friends of Bombay Hook) and still lost more than half its ducks. Part of the drop is bigger than one broken dike.
    2,714Black Ducks per Prime Hook flight since the 2016 restoration, the most of any era. The salt-marsh duck is the one doing better.

    Force 04 · The flooded corn paradox

    Corn is rocket fuel. It just doesn't last underwater.

    Per gram, corn gives a Mallard 3.67 kcal of usable energy, about 50% more than the 2.47 kcal average for native moist-soil seeds (Kaminski et al. 2003 and Reinecke et al. 1989, via USGS review). But flooded corn loses about half its value after 90 days, while hard native seeds and acorns lose almost nothing (USFWS Waterfowl Management Handbook).

    Grams a Mallard must eat to cover one day

    Based on 292 kcal per day for a free-ranging adult Mallard (Reinecke et al. 1989). Corn feeds a duck fast; marsh foods take far more feeding time.

    Usable energy per gram, and what's left after 90 days underwater

    Bars: true metabolizable energy (kcal/g dry). Tags: share of mass lost after 90 days flooded. Sources: USGS review, Checkett et al., Coluccy et al. 2014, Mississippi State invertebrate mean, USFWS, Leach et al. 2012.
    3.67kcal/g, corn
    2.47kcal/g, native moist-soil seeds
    50%of corn's mass gone after 90 days flooded
    1.39–2.74birds per hunter on corn-based WMAs
    32–59%of those bags were Wood Ducks

    What it means on the ground: corn draws ducks early, but by January a field flooded in November has lost much of its food, while a well-run moist-soil or wigeongrass unit is still feeding birds. The SCDNR records line up with that: corn-heavy WMAs produced fewer birds per hunter and leaned on local Wood Ducks. It's also why good managers keep corn dry until the second split (see how).

    Force 05 · Water spreads them out

    More water on the land, fewer ducks in the impoundments.

    There are two versions of this, depending on where you hunt. On the tidal coast, river stage barely matters, but two weeks of heavy rain fills the woods and fields with sheetwater. Inland, on non-tidal rivers like the Wateree, Congaree and Broad, it's the river leaving its banks?. Pick your water.

    Drag the slider and watch the ducks

    ––
    –of ducks inside the impoundment
    10 mm

    On the coast, the measured link is rain. Across 996 flyway days, more rain in the last 14 days meant a smaller share of the flyway's records in the Carolinas, even after controlling for time of season (r = −0.16, q = 2.5×10⁻⁵). In the Pamlico Sound zone, wetter-than-normal stretches went with fewer ducks than normal for the date (r = −0.32, p = 0.003, 82 two-week periods).

    Low river

    Inland, in the lowest-river third of hunt weeks, WMA hunters averaged 2.02 migratory ducks each.

    High river

    In the highest-river third, that fell to 1.53, about 24% fewer, as water spread into the timber.

    River result: 47 cleaned hunt weeks, 2021–22 to 2025–26, rank correlation ρ = −0.32 (p = 0.03). Flyway-wide, higher river gages also went with a smaller Carolina share (r = −0.13, q = 0.001). Rain: NOAA NCEI; rivers: USGS NWIS; harvest: SCDNR.

    River stage vs. migratory ducks per hunter

    Each dot is one statewide SC public WMA hunt week, 2021–22 to 2025–26, after removing a double-counted row, four out-of-season dates and one row with impossible species counts. Dot size = hunters. Line = least-squares fit.

    Weather gates · what moves ducks down the coast

    When it freezes up north, the Carolinas fill up.

    The WMA bag numbers can't see weather, as the sanctuary section explains. So this edition tested weather against the whole flyway: 36,674 dated band recoveries from Maine to Georgia. Every result below controls for time of season, so it isn't just December being December.

    1. Stage 1

      New York to New England

      Gate: hard freeze and snow

      More freezing hours over 14 days from New York to New England meant a bigger Carolina share of the flyway.

      r = +0.19 · q = 4×10⁻⁷ · 996 days

    2. Stage 2

      Chesapeake & Delaware Bays

      Gate: Virginia freeze

      More Virginia freezing hours meant a smaller share of ducks holding in the Chesapeake.

      r = −0.30 · p = 4×10⁻⁵ · 174 two-week periods

    3. Stage 3

      North Carolina sounds

      Gate: the wind axis

      Northeast wind in NC meant a bigger NC share. Southwest wind is the same reading in reverse, so it's one wind axis, not two findings.

      NE r = +0.21 · SW r = −0.21 · p = 0.006

    4. Stage 4

      South Carolina

      Gate: local freeze, NW wind

      SC freezing hours and northwest wind over North Carolina both went with a bigger SC share.

      freeze r = +0.27 · p = 0.0003
      NW wind r = +0.25 · p = 0.001

    5. Late winter

      The trip back north

      Mostly the calendar

      Warmer SC lows line up with the flyway moving north (raw r = +0.50), but most of that is the calendar. After controlling for date, the link is small.

      r = +0.16 · p = 0.04

    Stage results are single tests on two-week periods (see how to read r and p). The chart below only shows results that held up after correcting for all 762 tests.

    Flyway signals that passed correction for 762 tests

    Season-controlled partial correlation, 996 autumn and winter days, 2017–2024. All pass the false-discovery-rate test (q < 0.05); 98 of 762 tests did. Records: USGS BBL; weather: IEM ASOS, NOAA NCEI; rivers: USGS NWIS.

    How to read it

    Each bar shows how one condition lines up with one flyway measure, listed under its name. Right means that measure went up as the condition went up; left means it went down. The effects are modest one at a time (r of 0.1 to 0.2), but they stack. That is why the combined model beat the calendar on days it had never seen (see How sure).

    98 of 762flyway tests held up after correction
    0 of 660WMA bag tests held up once season and location were controlled

    Freeze and snow up north push birds south. Rain and high river stages go with a smaller Carolina share. High river flow also went with more late migrants in the mix, a pattern without a clear mechanism yet. Each signal alone is small. Stacked together, they're what lets Flyway Model v1 beat the calendar. The full list, including the weaker and early signals, is on the signal board.

    Replay · real days, scored out of sample · 3D

    Watch a cold wave come down the coast, and the forecast with it.

    Observed late-migrant share Blend v2, issued the morning before Calendar Watch High alert

    Each stage of the coast rises taller and turns whiter as its lows drop (14-day low for stages 1–3, 7-day low for South Carolina). Snow falls where the snowpack is building. Ducks flow faster on days the late migrants showed up in the band reports. Every number here is from the DeltaTrax lab's pre-issue forecast file, re-scored for this edition: weather known by midnight, forecast issued at 6 a.m., scored against USGS Bird Banding Laboratory reports. Weather: IEM ASOS and NOAA NCEI. The full seasons are on the scoreboard.

    Wind at duck height · 3D

    The forecast wind isn't the wind your decoys feel.

    Forecast wind is measured 33 feet (10 meters) up. Lower down, friction with the surface slows it. The standard log wind profile? estimates how much, and that depends on what the wind is blowing across. Drag the forecast wind, and spin the columns to see the slowdown.

    Open water · 2 ft14.8mph
    Marsh grass · 2 ft10.4mph
    Neutral-air log wind profile, u(z) = u₁₀ · ln(z/z₀) ÷ ln(10 m/z₀), with a surface roughness z₀ of 0.0002 m for open water and 0.03 m for open grass, the standard Davenport classes (log wind profile). It assumes a long, even stretch of the same surface. Behind a treeline or dike, or in still, cold morning air, the real wind can be much lower. This is a physics illustration, not DeltaTrax field data.

    What it means in the blind

    At a 20 mph forecast, about 14.8 mph reaches decoys on open water, and about 10.4 mph over marsh grass. Wind at head height in the blind is closer to the forecast than wind at the water.

    That's one reason a "windy" forecast can still leave a tucked-in pond workable, and why open water turns rough first.

    Lab-reported · re-run pending

    In the lab's tests on 399 SC WMA hunt weeks, open ponds averaged 22.8% fewer ducks per hunter when gusts hit 26 mph or more. Whether sheltered water does better in those gales is the next check, and that's exactly where opt-in hunt logs help.

    The signal board · 27 hunter beliefs, tested

    What hunters have always said, now with numbers.

    Every card below starts with something hunters say and shows what the records found. Some signals are strong, and some are faint. All of them count: no single one forecasts a hunt, but stacked together they're what lets Flyway Model v1 beat the calendar. The faint ones are exactly where real hunt logs will make the biggest difference.

    How to read r and p?

    r runs from −1 to +1. It shows how tightly two things move together: 0 is no link, +1 means they rise together perfectly, and −1 means one rises as the other falls. Weather and ducks never get close to ±1, because so many other things matter too.

    p asks whether a link could be luck. Below 0.05 is the usual bar. q is the same idea after correcting for running hundreds of tests at once, so it's the tougher bar.

    Drag the slider and switch the sample size. A faint r over 996 days can be rock solid, while a big r over 20 weeks can still be luck.

    Made-up example points, to show what each r value looks like. Not study data.
    Held up

    Passed the q < 0.05 bar after correcting for all 762 flyway tests.

    Strong single test

    p < 0.05 with the calendar removed, as a single test. Solid on its own, but one test among many.

    Early signal

    Small sample, raw only, or just short of p = 0.05. Kept as a candidate, and first in line for testing against hunt logs.

    Published research

    From peer-reviewed tracking studies, not DeltaTrax data.

    Every r here has the calendar removed?, so a signal isn't just "December is cold and ducks are south." Flyway results use 36,674 dated band recoveries; WMA and species results use 275 SC WMA hunt weeks; regional results use 82 two-week periods, 2017–2025. Records: USGS BBL, SCDNR. Weather: IEM ASOS, NOAA NCEI. Rivers: USGS NWIS. Moon: Osborne et al.

    The bag · all 18 species

    Teal carry South Carolina. Mallards are 2.5% of the bag.

    Share of 12,771 WMA ducks, five seasons

    Identified ducks from 275 SCDNR WMA hunt weeks, 2021–22 to 2025–26. Colors match the flyway map groups. Sources: SCDNR Waterfowl Archive and SCDNR public harvest records.

    Four species make up 63.7% of everything shot on South Carolina WMAs: Green-winged Teal, Gadwall, Blue-winged Teal and Shoveler. All four are marsh and mudflat feeders. Tap the months to see the bag change: Blue-winged Teal are 21% of November and 9% of January, while Mallards climb from 0.8% to 3.2%.

    3,575Green-winged Teal, 28.0% of the bag
    314Mallards in five seasons, 2.5%
    83Black Ducks, 0.65%

    Black Ducks show up in 418,034 banding records (354,681 bandings and 63,353 recoveries) but only 83 times in SC bags. Banding records follow where crews band, not how many birds there are. That's why the flyway map uses shares, not raw counts. Species-level weather links were all weak, and none held up once you account for testing 18 species at once.

    Where the food is · 3D

    One property grows two-thirds of the duck food SCDNR measured.

    In fall 2024, SCDNR measured food on its Category I waterfowl areas in Waterfowl Energy Days?. One WED feeds one duck for one day. The areas supplied at least 26,653,912 WEDs across 17,176 acres. Santee Coastal Reserve alone supplied 17,856,000, which is 67.0%. Switch to the January aerial count and the ducks are stacked in the same place.

    Santee Coastal Reserve67.0%of all WEDs
    Tower heights are to scale within each view, and locations are approximate. Santee Delta has no food estimate, because Hurricane Helene flooded it too badly in fall 2024. Tom Yawkey Wildlife Center is in the aerial count but not the food table, and Love Farm (6,000 WEDs) isn't mapped. Source: SCDNR 2024–25 Waterfowl Program Report, Tables 5 and 7.

    Food and ducks line up

    In the January 28–30, 2025 aerial survey, Santee Coastal held 59% of the 34,889 waterfowl counted on SCDNR's surveyed properties, and Yawkey held 32%. That's 91% on two neighboring properties. The total was 41% lower than 2024, after the January 21–22 snow froze many coastal impoundments a week before the flight.

    Read the big number carefully. Santee Coastal's 17.9 million WEDs are 11,160 acres of brackish aquatic bed multiplied by a published average of 1,600 WEDs per acre, not a field sample. The corn, rice and moist-soil numbers elsewhere were measured in the field.

    2025–26 season, ducks per hunter

    Donnelley and Santee Delta East posted the highest or near-highest averages SCDNR has recorded there. Aerial counts were up about 54% and ground counts up 104% from the year before. Bear Island's ducks fell about 50% as its marsh turned fresher. Source: SCDNR Waterfowl Advisory Committee, March 12, 2026.

    The 1976 Kinloch study · brackish impoundments, Santee Delta

    Wigeongrass is gone by December. Its seeds stay.

    University of Georgia researchers sampled two brackish impoundments on Kinloch Plantation every month in 1976–77. Wigeongrass leaves and stems peaked at 241 kg/ha in August and were gone by December. The authors blame filamentous algae that smothered the beds more than ducks. Its seeds held at about 10 kg/ha through February, even with up to 3,500 pintails feeding on them, and built up from year to year. Ducks and coots ate dwarf spikerush down from 856 to 363 kg/ha, while fenced-off test plots stayed full.

    The top food was saltmarsh bulrush seed, 45.8% of everything in 186 ducks and 50 coots, mostly eaten by pintails, mallards and Black Ducks (Prevost, Johnson & Landers 1978, SEAFWA).

    kg/ha air-dry weight available each month (bars scaled within each row; wigeongrass seeds were sampled from December on), and the share of food volume in duck and coot crops and gizzards. Source: Prevost et al. 1978, Tables 1–2.

    Up the coast · from the air · January 2026

    The whole coast from the air, then zoom in.

    Three agencies fly the coast every January: Delaware's DNREC over 11 bay and ocean zones, SCDNR over its coastal WMAs, and USFWS over 13 refuges from North Carolina to Florida. Start wide for the regional totals. Zoom in, or pick a region, and the map switches to zone, refuge and WMA counts, and the panel lists everything in view.

    January 2026 aerial counts, every survey we have

    DNREC, Delaware zonesSCDNR, S.C. WMAsUSFWS, refugesNo flight compiled yet
    Each count stays with its own survey and date: nothing is blended or estimated. Circle size follows the count. Delaware zone dots sit at approximate zone centers from DNREC's boundary descriptions. SCDNR reported Santee Coastal and Yawkey individually in 2026, and its other four WMAs as one combined number. New Jersey, Maryland, Virginia and Georgia show hatched until their January flights are compiled. Sources: DNREC aerial survey data; SCDNR Waterfowl Advisory Committee, March 12, 2026; USFWS, Midwinter Aerial Waterfowl Surveys on National Wildlife Refuges in the Southeast, 2026.

    Delaware, zoomed all the way in · 3D

    Fifty-two Januaries over Delaware, in one view.

    Since 1974, Delaware's biologists have flown the same 11 survey zones. That's 2,173 zone flights, and every one is public. Each tower below is one zone in one January. The bright green ridge is the bayshore, Zones 5–7, home to Bombay Hook and Prime Hook. Across 51 statewide January flights it held 73% of the state's ducks.

    January statewide flights, 1975–2026, all duck species added together. In 2024 only the three bayshore zones were flown. Source: DNREC Aerial Waterfowl Survey Data, Delaware Open Data. Totals here are counted from the raw file.

    The same 52 Januaries, flat: the bayshore carries the state

    73% of Delaware's January ducks on the bayshore, all full statewide flights

    Each bar is one January flight: green is the bayshore, blue is everything else. 2024 is pale because only the bayshore zones were flown that year. Same DNREC aerial survey data.

    Black Ducks, Delaware's January flight

    22,649 Black Ducks in January 2026, the most since 1978. Same DNREC file.

    What changed, counted the right way

    January 2026's statewide flight counted 59,709 ducks, the most since 2018. The bayshore zones went from 14,285 in 2024 to 44,626 in 2026, up 212%.

    The lab files say "+308%." That compares the 2024 flight, which covered only the three bayshore zones, with a 2026 flight that covered all 11. Like for like, it's +212%. Still huge.

    Mattamuskeet NWR, North Carolina · 16 blinds · 2021–2024

    Same lake, same mornings. Three blinds took half the ducks.

    Over three seasons, 1,913 hunters drew the refuge's 16 lottery blinds. Blinds 1–3 averaged 0.81 ducks per hunter and took 48.6% of the refuge's bag, with only 26% of the hunters. Blinds 6–13 averaged 0.27 and needed 10.2 shots for every duck bagged.

    The lab places Blinds 1–3 near canal mouths and Blinds 6–13 out on open water, where the lake's grass beds have thinned. We haven't checked the blind map yet, so read that as the lab's explanation. The bag numbers are straight from USFWS's blind-by-blind hunt sheets.

    Ducks per hunter, by blind

    Blinds 1–34–5, 14–166–13
    2021–22 through 2023–24, three seasons pooled. Dots show shots fired per duck bagged (right scale). Dashed line: refuge average, 0.43 ducks per hunter.

    13 coastal refuges, North Carolina to Florida · flown January 5–17, 2026

    From the air last January, Mattamuskeet held more ducks than the next 12 refuges combined.

    USFWS crews flew 13 coastal refuges in early January. They put Mattamuskeet at about 262,000 ducks, mostly wigeon, shovelers and pintails. All 12 others together came to about 200,000. The divers sat on the big open water: 61,000 at Pea Island, 27,000 at Santee, 17,000 at St. Marks.

    These are USFWS's adjusted mid-winter estimates, not raw tallies, from the 2025–26 season. Waccamaw was flown on January 14 with no ducks seen. Savannah NWR wasn't flown in 2026, so Georgia isn't shown. Source: USFWS, Midwinter Aerial Waterfowl Surveys on National Wildlife Refuges in the Southeast, 2026.

    Waterfowl by refuge, January 2026

    DabblersDiversGeeseSwans
    USFWS mid-winter abundance estimates, January 2026. The total at the end of each bar includes geese and swans.

    The sanctuary problem · a correction

    Why the WMA numbers can't see the weather.

    The first version said calm weeks did just as well (3.00 birds per hunter under 12 mph vs. 2.02 at 12–20 mph). That came straight from the raw WMA table, and it was misleading.

    Draw hunts happen on set days, inside impoundments that are rested the rest of the week. Hunters walk in where the birds already sit, whatever the weather. The bag measures the sanctuary, not the movement. Once time of season and location are accounted for, 0 of 660 weather tests on WMA weeks hold up.

    That's the study's explanation, a selection effect and a form of Simpson's paradox, where a pooled table points the wrong way. The data doesn't prove it directly. What it does show is that the wider flyway records, which aren't tied to one rested pond, respond to weather clearly.

    3.00raw birds/hunter, calm weeks (first version)
    0 of 660WMA weather tests that survive with controls
    98 of 762flyway weather tests that survive

    How ducks trade between sanctuary, public water and private ponds

    Press Play to run all four conditions, or tap one.

    Schematic, not a real site. Duck movement here is a field model to show the idea. Each statement above is tagged by how well it's supported.

    Shots fired per hunt morning, SC WMAs

    Reported shots ÷ dated hunt mornings, 2024–25 and 2025–26. Usual hunt days shown under each name. Source: SCDNR public harvest records.

    Gunfire is measured. The flush isn't.

    Murphy Island averages 303.7 shots a hunt morning over 21 recorded mornings, hunted Tuesday, Wednesday, Thursday and Saturday. Hickory Top averages 280.5, and The Cape 267.1. That much gunfire on a rested pond almost certainly moves birds. Guides say it pushes them out onto nearby public water between about 6:45 and 10:30. That's a field rule, though. These records don't track where the birds go.

    Published research

    In an Arkansas GPS study, mallards moved 2.1 times farther at night under a full moon than a new moon during hunting season, with no change when hunting was closed. Wigeon and mallards also moved 37% and 28% farther by day than by night (Osborne et al., Dryad). That's Mississippi Valley data, not tested here.

    Satellite water check · October 2026 · corrected

    Yawkey and Cape Romain are flooding early. The late-flood units are waiting.

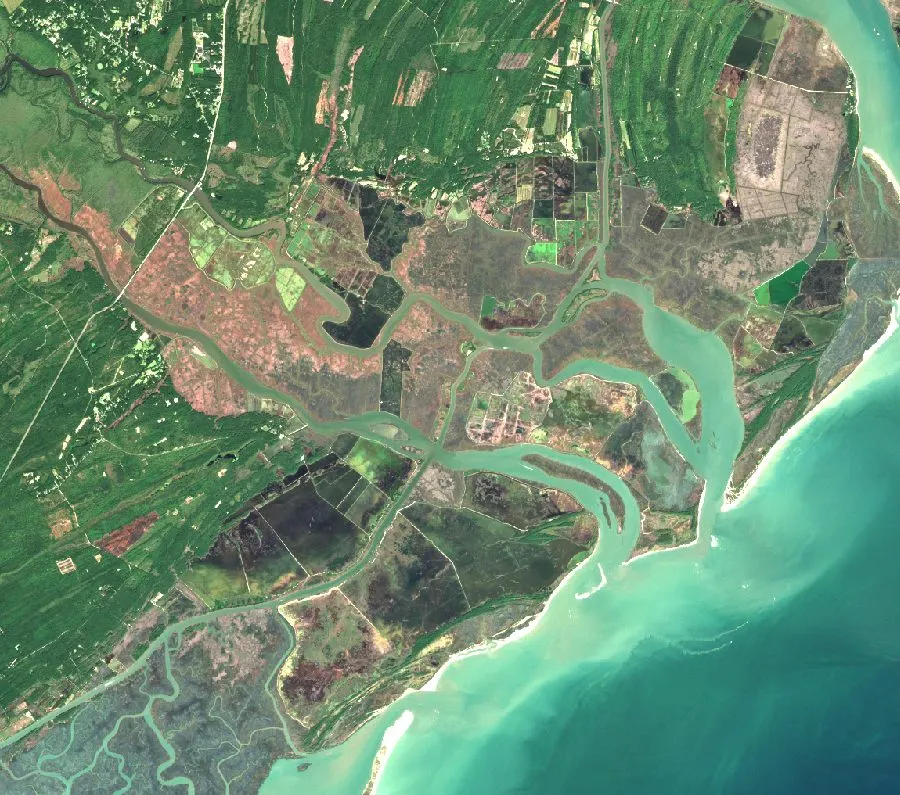
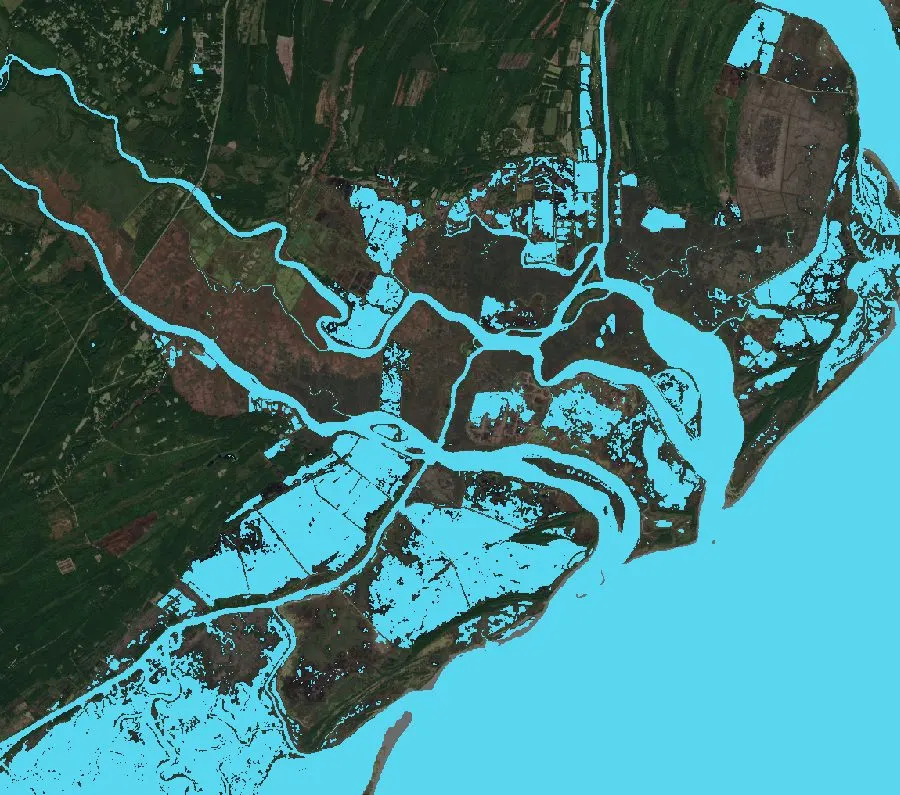
    Sentinel-2 images from October 6–21, 2026, with clouds and shadows masked out, show how much of each wetland is open water, how green it was this summer and how this October compares with last. Each site is a 2.8 km square (784 ha, about 1,940 acres) around the wetland, not the impoundment boundary. Tom Yawkey is 53.9% water, 21.3 points wetter than a year ago, and Cape Romain is up 13.1. 15 of 27 sites are wetter than last October. A few big units are nearly dry, like Donnelley (0.0%), Hyde County's corn rim (0.15%) and Kinloch (1.9%). That's usually a choice, not a drought, as the trunk section below explains.

    How trunks and spillways set the water

    Dry in October, often on purpose.

    Carolina impoundments don't fill with the rain. Managers set the water with rice-field trunks, flashboard risers and spillways, pulling boards to drain a unit and dropping them back in to flood it. So a dry unit in October is usually on schedule, not in trouble.

    1. Spring–summer · Apr–SepBoards out, mud up

      The water is drawn down so smartweed, panicgrass, Walter's millet, sprangletop and chufa grow on the exposed mud, or corn gets planted. The Cape's North Cell was 50.0% lush green in September.

    2. 1st split · Oct–NovMoist-soil units come up

      Boards go back in to flood the seed for teal, pintail, gadwall and wigeon. Yawkey is +21.3 points wetter than last October, Bear Island's central cell +10.8 and The Cape North Cell +4.6. Right next door, The Cape South Cell is 63.4 points drier, on a later schedule.

    3. 2nd split · Dec–JanCorn floods late

      Flooded corn loses about half its value in 90 days, so smart managers hold it dry. In mid-October, Hyde County's corn rim was 0.15% water, Kinloch 1.9%, Wateree & Goodwill 4.4% and Donnelley 0.0%, despite 65% to 98% green summer cover. They flood for the late mallards, black ducks and wood ducks.

    4. All year · brackish unitsHeld full for wigeongrass

      In brackish units like Murphy Island, the trunks hold water over the beds year-round, at about 8 to 18 ppt salt, so the wigeongrass never dries out. Its mapped cell is 99.7% water, the same as last October.

    Four mapped impoundment cells, checked pixel by pixel

    Exact USFWS National Wetlands Inventory boundaries for diked units, not sample squares. Each one was rechecked by a second method with zero pixel difference.

    Open water = MNDWI? above 0 on the Oct 14, 2026 and Oct 2025 Sentinel-2 scenes, inside each USFWS NWI polygon (the "h" code means diked or impounded). Satellite readings show surface water and greenness on the image date. They don't show depth, which plants are duck food, whether ducks are there, or legal access.

    Coastal Carolinas water, today

    Where the water is right now, and where the ducks were last January.

    What the satellite sees

    Drag to peel back the water layer.

    True-color Sentinel-2 image
    Same scene with water pixels highlighted
    Water layerTrue color

    All 27 wetlands, October water cover

    Water = share of valid pixels reading as open water (MNDWI? above 0) in each 2.8 km sample square. Habitat index? (0–100) blends summer food, water now, summer growth that's now flooded and the change from last October. It rates the habitat, not the number of ducks. Each bar is labeled "Satellite water/vegetation observation" for its acquisition date. Imagery: Copernicus Sentinel-2 L2A.

    Find the food, find the ducks · South Carolina public lands · 2024–2026

    The wigeongrass pockets hold the coast's ducks. Corn doesn't come close.

    Every SCDNR check-station report from the last two seasons, one row per hunter, sorted by what each unit is managed to grow. Then last January's aerial count over the same ground. Then the satellite read that finds those pockets as they flood, and tells you why each one made the map.

    75.2%of all ducks reported on SC's public draw units came from four brackish wigeongrass impoundments, with 67% of the hunters
    1.9×ducks per hunter on wigeongrass (3.23) vs. planted corn, millet and sorghum (1.71)
    97.1%of the 53,889 ducks SCDNR's plane counted in January 2026 sat on two brackish wigeongrass properties, Santee Coastal Reserve and Yawkey

    Share of hunters vs. share of ducks, by what the unit grows

    Share of huntersShare of ducks
    2,053 hunter reports and 5,943 ducks from 16 SCDNR Category 1 tracts, Nov 2024–Feb 2026. When the green bar is longer than the gray one, that habitat out-produced its share of hunters. Food type comes from SCDNR's own management records (Bear Island review, WHSRN: Santee Coastal and Santee Delta, SCDNR Waterfowl Advisory Committee, Nov 2025, SREL, Broad River). Source: SCDNR public harvest records.

    From the air: waterfowl per managed acre

    SCDNR's January 28–30, 2025 aerial survey, the latest with a count for every property, divided by each property's managed wetland acres. Santee Delta's moist-soil units sit a mile from Santee Coastal Reserve and held 109 birds on 1,135 acres. In January 2026, Santee Coastal (38,960 ducks) and Yawkey (13,349) held 97.1% of the 53,889 counted. Counts: SCDNR aerial survey file and SCDNR Waterfowl Advisory Committee, March 12, 2026. Acres: SCDNR waterfowl project report: Yawkey about 3,000, Santee Coastal about 14,000, Bear Island 5,385, Santee Delta 1,135. Yawkey is a no-hunting sanctuary, which helps hold birds too.

    Each food draws its own ducks

    Pintail, Wigeon, GadwallTeal & ShovelerMallard, Black Duck, Wood Duck, Ring-neckOther
    Share of each habitat's bag, same SCDNR reports. On wigeongrass, more than a third of the bag was Pintail, Wigeon and Gadwall, the ducks that graze underwater plants. On corn and grain, 59% was Mallards, Wood Ducks and Ring-necks.

    DeltaTrax habitat layer · 3D

    How it finds the pockets, and why each one made the map

    High: wet, good habitat, ducks confirmed Moderate: wet and promising Watch: some water, weak signal Waiting on water: held dry for now
    Public lands only. Private ricefields and farms read by the satellite are left off. Column height is the habitat index (0–100) from Sentinel-2: summer food, water now, summer growth now flooded and change since last October. The glowing disc is the share of open water. Tier: High needs at least 18% open water now (the DeltaTrax habitat rule for active feeding), an index of 42 or better and a public duck count that confirms use (a January count over 5,000, or 3+ ducks per hunter). Moderate needs 18% water plus a good index or some confirmed use. Older summer growth never counts if the unit is dry today. Under 10% water is "waiting on water", usually a unit held dry for a later flood. Imagery: Copernicus Sentinel-2 L2A, Oct 6–21, 2026.

    Inside a pocket · Sentinel-2 · 3D

    What the satellite sees, one 10-meter square at a time.

    Open water Plants in water Green plants, no standing water Mud, dry or sparse
    Every block is one real 10 m × 10 m pixel from the Oct 14, 2026 Sentinel-2 pass, clipped to the cell's outline from the USFWS National Wetlands Inventory. How each pixel is sorted: first, is there water (green band vs. shortwave infrared, MNDWI above 0)? Then, how green is it (NDVI)? Water that's still green counts as plants in water. Block height follows greenness. Bare water stays flat. Public land only. Imagery: Sentinel-2 L2A on AWS, from Copernicus.

    When ducks switch foods

    Corn is the richest food out there. In the Lowcountry, ducks still pick the wigeongrass.

    A gram of corn carries more than three times the energy of a gram of wigeongrass. So why do the brackish units win? Wigeongrass beds come with seeds, snails and midge larvae, the protein and calcium corn doesn't have. They hold water all season, and flooded corn rots, losing half its energy in 90 days. Pick a situation to see where the research says ducks feed.

    Energy ducks get per gram

    True metabolizable energy, kcal per gram. Corn: Reinecke et al. 1989. Moist-soil seeds: Kaminski et al. 2003, in the same review. Wigeongrass: Coluccy et al. 2014. Flooded corn: the 50% loss in 90 days is from the NRCS waterfowl handbook.

    75.7%Wigeongrass units' share of the ducks on cold-morning hunts, when Charleston hit 32°F or colder in the three days before
    74.9%Their share on mild mornings. No shift, 81 hunt days, permutation p = 0.92
    6.4%Corn-and-grain units' share in the cold, down from 7.6% on mild days. Cold didn't send SC's public-land ducks to the corn

    How DeltaTrax uses this: the habitat layer tracks which food is under water right now, using Sentinel-2 plus each unit's trunk and drawdown schedule. Weather tells Blend v2 when birds are coming, and the food tells the map where they'll settle. The cold check uses IEM ASOS daily lows at Charleston (KCHS) against SCDNR's dated hunt reports, two seasons.

    Current season · 2026–27

    The 2026–27 season: more divers, fewer mallards, steady Black Ducks.

    This is the current season, and this year's birds are working their way south. This isn't a forecast yet. It's what the May 2026 breeding counts say about the birds coming south this fall.

    Up781,600

    Canvasbacks

    32% above the long-term average. Redheads are up too, at 931,000 (26% above average), and shovelers reached 3.29 million, 19% above 2025.

    Down5.86M

    Mallards

    The lowest breeding count since 1993. Eastern mallards fell to 890,000, 23% below their average.

    Steady739,200

    Eastern Black Ducks

    Down 6% from 2025 but still above their average. Delaware's January flight just counted the most since 1978.

    Up829,000

    Eastern Ring-necked Ducks

    16% above average and 9% above 2025, counted on the eastern breeding grounds. Ring-necks are a mainstay of Carolina impoundments and timber.

    Sources: USFWS 2026 Waterfowl Population Status, Tables 10, 11 and 13, and the DNREC file above. DT-Empirical Blend v2 now turns signals like these into a daily 24-hour outlook. See today's.

    DT-Doppler · 24-hour migration outlook · 3D

    The next 24 hours, coast by coast.

    DT-Doppler is the DeltaTrax model's forecast layer, the same one going into the DeltaTrax map. The outlook below is Blend v2's first, for Friday, Oct 23, built only from weather through Thursday night. It's a quiet one, and that's the honest read for late October. Each column is a stretch of coast. Its height is the share of late-season ducks? the model expects in the mix. Its color is the migration day alert?. The drifting specks are the wind. Tap a column, or a region below, for the why.

    Blend v2 · for Fri, Oct 23, 2026Weather through Thu, Oct 22 · run Sat, Oct 24 · flyway-wide 4.0% vs. calendar 2.5%
    Forecast values: DeltaTrax lab, Blend v2 outlook rows for Oct 23, 2026. We re-ran the flyway-wide value from the model's saved weights (4.0%) and checked the pressure falls against Iowa Environmental Mesonet airport records for Portland, Maine and Charleston. Georgia gets a column once v2 has a Georgia corridor. Wind specks switch to live National Weather Service station winds when the page can reach them. Columns are regional, never a hunting spot. The sweep is for show: NEXRAD weather radar sees rain and can't tell ducks from songbirds, so DT-Doppler models movement from the weather instead.

    Live at the coast · NWS · loading

    Migration day alertThe pressure, freeze and water pattern that came before big days in past seasons.
    Migration watchSome of the pattern is in place. Worth a scout.
    RoutineLocal conditions rule. Birds shift, they don't arrive.

    New model · DT-Empirical Blend v2

    The second DeltaTrax model, scored on seasons it never saw.

    Every forecast below? was made the way the app makes them: with only the weather known by midnight, issued at 6 a.m., before the day happened. Then it was scored against what the band reports showed. Lower error means fewer misses.

    23.6%

    fewer misses than the calendar across four unseen seasons, 554 days. 16.5% fewer than Flyway Model v1, and 9.7% fewer than Blend v1.

    Checked · re-run from the lab's 918-day file

    Average error, lower is better

    Mean absolute error? on the daily late-season share. Calendar = what a normal year looks like on that date.

    What it would have said: the season, replayed day by day

    • Actual
    • Blend v2, issued the morning before
    • Calendar
    • Big migration day
    Late-season share: of each day's duck band reports from 17 eastern states (Florida excluded), the share that came from divers and late-migrating dabblers. It rises when the late birds arrive. Source: DeltaTrax lab pre-issue forecast file, built from USGS Bird Banding Laboratory records with weather cut off 6 hours before each 6 a.m. issue.

    Same big days caught. Far fewer false alarms.

    False alerts on quiet days · 2022–23 and 2023–24

    Calendar
    42
    Flyway Model v1
    37
    Blend v1
    31
    Blend v2
    19

    Blend v2 on the 39 big migration days

    • Alert · 20
    • Watch · 15
    • Missed · 4
    274 days, 39 of them big migration days. Run through the same alert rule (top 30% of training-season forecasts = alert, top 50% = watch), every model, and the plain calendar, flags 35 of the 39. Big days pile up in February, so timing alone finds most of them. All four miss the same four, Dec 8 and Dec 19–21, 2022: early surges nothing in the record saw coming. Where the models pull apart is crying wolf. Blend v2 sent 19 alerts on quiet days, vs. 42 for the calendar and 31 for Blend v1, and a big day followed 51% of its alerts, about 3.6 times the normal rate. Big migration day = the top of the late-season share, set from 2017–2021 only.

    Plain read

    • It's regional. The forecast reads the whole flyway, then five stretches of coast from New England to South Carolina. The satellite layer zooms in to individual flooded pockets.
    • Every season improved. The gain over the calendar ran 17% to 38% depending on the season, and it beat Blend v1 in all four.
    • This time it isn't luck. Against Blend v1 the gain holds over four seasons and over two (block test, p < 0.001 and p = 0.001). Blend v1 over Flyway Model v1 never cleared the two-season test.
    • Still to prove. The lab picked v2's new inputs using these same seasons, and on 2019–20, a season off the scoreboard, v2 did no better than v1. The 2026–27 live test is the clean check.
    • Band reports aren't a census. They show which ducks hunters shot and reported. That's why hunt logs are the next ingredient.

    Under the hood · what Blend v2 reads every night

    32 scored inputs, eight families, Maine to the Lowcountry.

    Every input is measured the day before, never after. It reads four latitude bands from New England down to the Lowcountry, so it sees a cold front, a freeze or a snowpack build up north before the birds move. It learns from day-by-day USGS band reports across 17 eastern states, 2017–2024, lined up against hourly airport weather, daily snow and river readings and water-temperature gauges.

    8

    Air temperature by latitude

    14-day lows in four bands, the north-to-south gradient, local vs. northern gap, daily highs, day–night swing

    4

    Barometric pressure

    Pressure gradient across the flyway, post-front surges timed with freezes, frontal swings, the week's sharpest drop

    4

    Wind

    North wind down the flyway corridor, 7-day sustained north wind up north and in N.C.–Va., 3-day north–south push

    4

    Freeze and snow

    A stepped freeze cascade from Maine south, snow lockout up north, snow depth in New England and the mid-Atlantic

    4

    Water temperature

    Delaware Bay and Santee gauges, the gap between them, and the water-vs-air steam-fog setup

    3

    Fog, dew and drizzle

    Dewpoint spread over the week and in the afternoon, hours of drizzle

    3

    Rivers

    Gauge height, 14-day flow, and how a northern freeze lands on a river that's in its banks or flooding the timber

    2

    Season timing

    Where the day sits in the season, so the weather is read against what's normal for that date

    Left out on purpose: the tide. Coastal marshes get two tides a day, every day, so the tide alone can't tell one day from the next. Wind, pressure, freeze and snow can, and those are what the model reads.

    Around the core · what DeltaTrax adds before it reaches the map

    M2Habitat invite

    Sentinel-2 satellite water every few days across 27 wetlands, summer food now flooded, the habitat index, trunk and drawdown timing, and the 82.4% homing rate of SC summer-banded ducks

    M3Local conditions

    Coastal rain, inland river stage, wind off the refuge, moon phase, draw-hunt gunfire, dawn mist and fog

    DTDT-Doppler

    Turns the core forecast and both layers into the regional outlook and migration day alert on the DeltaTrax map

    The 32-input core is what's scored on the scoreboard above. The M2 and M3 layers are built from the same public records and shape what each region's outlook says. They're tested separately in the lab's cross-tests below.

    What v2 adds · 12 new inputs

    Snow on the ground and a steady north wind did the most work.

    Blend v2 keeps all 18 of Blend v1's inputs and adds 12, all read the day before. The biggest one, snow cover up north, was in Flyway Model v1, got left out of Blend v1, and is back. River flow came back too. The rest are sustained wind, the sharpest pressure drop of the week, and four ways of reading how air and water temperatures pull against each other.

    Bar length: how much worse the four-season score gets if that one input is taken back out. No single input carries the gain, which is what you want to see. Re-run here from the lab's 918-day file.

    Extra error without each input

    Change in four-season walk-forward error (554 days) when one input is removed and the model is refit. Same Ridge model and folds as the scoreboard.

    Since Blend v1 · four weather signals

    Pressure, water, fog and rain: what hunters feel, now in the model.

    Each signal is read from the day before a forecast, so the model never peeks. Two are checked here from the lab's day-by-day file. Two come from the lab's own tests and are marked that way.

    01

    A pressure surge after a freeze

    When high pressure builds in behind a front and it's been freezing up north, the late birds come. On the strongest surge days, the late-season share ran twice the no-surge level.

    Average late-season share by surge strength, 918 days, 2017–2024. r = +0.24. Checked
    02

    Cold water

    Below about 39°F, shallow marsh skims over at night and dabblers move. Delaware's water temperature tracks duck activity closely (r = −0.45), mostly because cold water and the season arrive together. The gap between South Carolina and Delaware water adds on its own.

    Median daily duck band reports, eastern states, by the day-before water temperature at USGS 01484080, Murderkill River, Del. Checked The SC-minus-Delaware gap (partial r = +0.11): Lab
    03

    Fog cuts both ways

    A light mist, 1 to 5 miles, softens glare, keeps birds low and went with more movement. Dense fog under half a mile is a boating hazard, and the ducks either sit tight or fly above it.

    1. Over 5 miClear. Sun glare on calm mornings.
    2. 1–5 miLight mist. The good one.
    3. ½–1 miFog caution on rivers and creeks.
    4. Under ½ miDense fog. Stay off the water.
    Dawn fog predicted a day ahead from dewpoint, humidity, wind and water-minus-air temperature, tested on 51,629 dawn hours (AUC 0.90 for dense fog). IEM ASOS data. Lab
    04

    Showers good, storms bad

    Scattered frontal showers had the best SC WMA hunts, as ducks traded between bands. Heavy rain and storms had the worst. A week of heavy rain floods the timber and pulls birds off public impoundments.

    Ducks per hunter on 82 SC WMA hunt days, 3,166 hunter-days, by rain that day. Built from SCDNR WMA results and NOAA rain. Lab

    From the model to your map

    Every morning at 6, the model writes one file. The DeltaTrax map reads it.

    01Public data, overnight

    NWS and ASOS weather, USGS water temperature and river levels, banding records, satellite water.

    02DT-Empirical Blend v2

    Reads only what was known by midnight: 32 inputs across temperature, pressure, wind, freeze and snow, water temperature, fog, rivers and season timing. Sentinel-2 water and food come in through the habitat layer.

    03DT-Doppler

    Turns it into a 24-hour outlook and a migration day alert for each stretch of coast.

    04The DeltaTrax map

    Shaded forecast regions, never a named private spot. Every layer shows the model version and the data date. Missing data shows as gray, never a guess.

    Your logs, your map

    Public records stop at the refuge gate. Hunt logs fill in the rest: date, area, hours, birds seen, birds taken, and the slow days too. More logs from a region tighten its forecast. Roughly, four times the logs halves the uncertainty.

    A hunt group that logs a lot gets a sharper map than a group that doesn't. That's the payoff for logging.

    No field-trial logs are in this model yet. Its confidence today comes from public records and years of the founder's own field notes, kept separate from any user data.

    Public mapRegional forecasts only

    Nobody's spots, hunts or reports ever appear.

    Improving the modelOpt-in, area totals only

    If you choose to share, your logs train the model as area-level totals. Off by default. Turn it off and your logs leave future training.

    Your hunt groupExact spots, by invite

    Each person grants access to each buddy directly. Leave the group and access ends. Never sold, never given away.

    The models · how sure are we?

    Each model has beaten the one before it. DT-Empirical Blend v2 beats them all.

    DeltaTrax has built four models so far. The first one taught us what not to predict, the second one worked, the third one sharpened it, and the fourth now runs the forecasts. Each one was trained on earlier years and then scored on years it had never seen. The yardstick is the calendar?: what a normal year looks like on that date. Beating it means the weather added real information.

    1. Retired as a forecaster

      First model

      The WMA bag model

      Question
      How many ducks per hunter will an SC WMA draw hunt see this week?
      Data
      275 WMA hunt weeks, 2021–22 to 2025–26, plus local weather.
      Result
      Couldn't beat location plus season: 2.6% to 15.9% worse on unseen seasons.
      Lesson
      Rested sanctuary hunts hide the weather (see why). The model now serves as a cross-check.
    2. The beta · still the migration engine

      Flyway Model v1

      The flyway model

      Question
      Where along the flyway are the ducks this week, and how many late migrants have arrived?
      Data
      36,674 dated band recoveries from Maine to Georgia, 2017–2024, plus freeze, snow, wind, pressure, rain and river readings at fixed stations from New York to South Carolina.
      Result
      12.0% more accurate than the calendar on daily arrivals, and that holds under the tougher 14-day block test (p = 0.003). It's also 7.4% better on the two-week Carolina share, but that one doesn't clear the block test once back-to-back periods are accounted for.
      Why it works
      It follows the whole flyway, so it sees birds move before they reach a rested pond.
    3. Previous · Oct 23, 2026

      DT-Empirical Blend v1

      The first DeltaTrax model

      Question
      Is a migration push coming in the next 24 hours, region by region, and how much of the mix will be late-season ducks?
      Data
      Flyway Model v1 as its engine, plus pressure surges after a freeze, USGS water temperature, dawn fog and visibility, and rain intensity. Every input is read from the day before the forecast is issued at 6 a.m.
      Result
      15.5% more accurate than the calendar and 7.6% more accurate than Flyway Model v1 over four seasons it never saw (554 days). It flagged 35 of 39 big migration days, the same as the calendar, with 31 false alerts to the calendar's 42.
      Now
      All 18 of its inputs carry into Blend v2.
    4. Current · runs the DeltaTrax forecasts

      DT-Empirical Blend v2

      The current model, with DT-Doppler

      The engine behind DeltaTrax's predictive forecasting and modeling software

      Question
      Is a migration push coming in the next 24 hours, where along the coast will it land, and how much of the mix will be late-season ducks?
      Data
      32 scored inputs in eight families, all read the day before: air temperature in four latitude bands, barometric pressure gradients and surges, wind, freeze and snow, Delaware Bay and Santee water temperature, fog and dew, rivers, and season timing. Around that core, DeltaTrax layers Sentinel-2 satellite water and food, the habitat index, trunk timing, homing and local conditions. See everything it reads
      Result
      23.6% more accurate than the calendar, 16.5% more than Flyway Model v1 and 9.7% more than Blend v1 over the same four unseen seasons. On the two-season backtest, 15.0% better than Blend v1. Same 35 of 39 big days flagged, but only 19 false alerts, down from 31, and its alerts were right 51% of the time vs. 45%. See the replay
      Key point
      It runs on public data today. Hunt logs that hunters choose to share will sharpen it region by region.

    How the models are built

    1. Gather2.4M banding records, 1.8M hourly weather readings, 76K daily climate and snow records, 73K daily river readings, 2,135 SC check-station entries and 27 satellite sites.
    2. Line upEvery duck record is matched to the weather in the days before it, at its own station and at fixed stations up the flyway.
    3. Remove the calendarSeason timing is taken out first, so a link isn't just December being December.
    4. Test every linkEach pairing gets an r for strength and a p for luck. Then the whole batch is corrected (q) because 762 tests at once will throw up some flukes.
    5. Score on unseen yearsTrain on earlier seasons and predict later ones the model never saw. Then a block bootstrap? checks it again, so back-to-back days can't count twice. Only that score counts as a win.

    First model: WMA ducks per hunter

    Change in average error? vs. the location-plus-season yardstick. Green = better, rust = worse. None of the differences favor weather significantly. Source: Flyway Model v1 evaluation on 275 deduplicated WMA weeks.

    Where things stand

    • Blend v2 is the best yet. 23.6% fewer misses than the calendar over four unseen seasons, block-tested (p < 0.001). Against Blend v1 it's 9.7% better over four seasons and 15.0% over two, and both clear the block test by our re-run (p < 0.001 and p = 0.001). Blend v1's 6.2% edge over Flyway Model v1 on the two-season backtest never did. The 2026–27 season is the live test: every forecast is logged before the day and scored after.
    • Every model has beaten the one before it. On the same four unseen seasons, Flyway Model v1 cut misses vs. the calendar by 8.5%, Blend v1 by 15.5% and Blend v2 by 23.6%. And the more seasons of data it learns from, the better it gets. See the climb
    • It finds the pockets and forecasts the region. The satellite layer reads Sentinel-2 water pixel by pixel at 10 meters, inside exact impoundment boundaries, so it already picks out small, isolated flooded pockets as they open up. The duck forecast is scored at the flyway and coastal-region level. Putting a duck number on one small pocket is the next step, and shared hunt logs make it possible, because no public record counts ducks that finely.
    • WMA bags were the wrong target. On 2025–26 the first model was 3.6% to 15.9% worse than the yardstick, and SCDNR's switch from weekly PDF summaries to Survey123 check-station reports changed the data mid-stream. The weather signal is there. The rested-pond bag just hides it.
    • Band reports show where ducks were shot and reported, not how many exist. That's why hunt logs matter so much.
    • Correlation is a lead, not proof. Climate, corn, habitat and rules all changed at once. Each signal gets tested forward before it guides a hunt.
    • Next proof point: real hunts. None of this has been checked against DeltaTrax field hunts yet, and no private crew data is used here.

    How DT-Empirical Blend v2 is built · three sub-models

    One duck outlook, built from three sub-models.

    DT-Empirical Blend v2 is the engine behind DeltaTrax's predictive forecasting and modeling software. Like SailFlow does for wind, it rolls many weak and strong signals into one simple outlook. Flyway Model v1 is M1, its migration engine. M2 and M3 add what the satellite and the local weather can see, and DT-Doppler turns it all into a 24-hour outlook.

    M1Migration push

    Flyway Model v1. Is a push coming down the coast?

    • Northern freeze · r = +0.19
    • Virginia freeze · r = −0.30 Chesapeake
    • NE–SW wind axis · r = ±0.21
    • NW front · r = +0.25 SC
    • Falling barometer · r = +0.14
    • Snow cover up north · back in v2
    • Sustained north wind · new in v2
    • Post-front pressure surge × freeze · r = +0.24
    M2Habitat invite

    Is the water there, and is food in it?

    • Sentinel-2 water every few days
    • Summer food now flooded
    • Habitat index: Cooper River 61.2, Murphy Island 48.6
    • Trunk timing: Hyde County corn 0.15% water on Oct 16, held for the 2nd split
    • Homing: 82.4% of SC summer-banded ducks come back
    M3Local conditions

    What will the birds do near you tomorrow?

    • 14-day coastal rain · r = −0.32 Pamlico
    • Inland river stage · r = −0.30 Pee Dee
    • Wind off the refuge · r = −0.21
    • Moon phase · 2.1× night movement
    • Draw-hunt gunfire · 304 shots a morning
    • Dawn mist, fog and rain intensity · new
    The missing ingredient: hunt logs.

    Every public number here comes from refuges, check stations or banding crews. None of it records what happened on public rivers and private water, hour by hour. Hunt logs that hunters choose to share in DeltaTrax fill exactly that gap. They're the data most likely to turn today's faint signals into strong ones. Sharing is opt-in only, and private spots stay private.

    DeltaTrax lab notebook · 43 hypotheses · 23 cross-tests

    What the lab is testing next, in plain terms.

    The lab's notebook lists 43 hypotheses (H1–H43) and 23 cross-tests (CT1–CT23), now stretching from Maine to Florida and out to the prairies. The cross-tests check whether a pattern holds in more than one place. The results look promising, but none have been re-run outside the lab yet, so they're shown as patterns under test, not laws. Personal hunt logs, private plantation records and named private spots are left out.

    CT1Opening-week fade

    Units hunted from a single tract dropped 25–43% after the first one or two hunts. Units that rotate their rest areas held steady.

    15 SCDNR WMA subunits · 399 hunt weeks
    CT2Water up by opening day

    Openers with the water up averaged 3.71 ducks per hunter. Openers during drought averaged 0.77.

    20 subunit seasons · Sentinel-2 water
    CT3Gale penalty

    On open WMA ponds, gusts of 26 mph or more cut ducks per hunter by 22.8%, and it took more shots per bird.

    399 WMA hunt weeks · NOAA wind
    CT4Salty bays are fickle

    Pintail counts on full-salt open bays swing far more than on brackish impoundments. Half of bay counts drop the next day, while most impoundment flocks stay for days.

    418 eBird pintail checklists · 14 sites
    CT5Mid-December lull

    River corridors dropped 55–78% in mid-December, then rebounded 3–11× during late-January freezes.

    685 eBird checklists · 7 corridors
    CT6The northern trigger

    Coastal complexes surged 2.6–4.1× together when New York's winter severity turned hard and strong north-northwest winds blew aloft.

    20,675 eBird checklists · 81 sites
    CT7Moon lag

    On the day of a full moon and the day after, impoundments beat rivers. Two to four days later, river shooting rose 57.5%.

    302 dated SCDNR daily hunts
    CT8Thin ice vs. hard ice

    Skim ice cut late-season bags 11.8% and made river shooting harder. Solid ice (0.4 in or more, 21°F or colder) cut impoundment bags 22.3% and pushed birds to moving water.

    251 late-season weeks · 282 daily hunts

    15 more cross-tests from the lab

    1. CT9Partial drawdowns, snails and algae in wigeongrass ponds
    2. CT10How many rest days a pond needs between hunts
    3. CT11Salinity decides which ducks use a marsh
    4. CT12River gauges and salinity as early warnings
    5. CT13Why some cells in one impoundment hold 3–5× more ducks
    6. CT14Public water between a sanctuary and a feeding pond
    7. CT15The mild-December lull and the cold-snap switch
    8. CT16Managed impoundments, Florida to Maine
    9. CT17Lakes that lose their grass beds, Mattamuskeet to Florida
    10. CT18Drought years and the brackish wigeongrass comeback
    11. CT19Guana River, Florida: 12 years of grass collapse and rebound
    12. CT20How a northern freeze cascades from Maine to Florida
    13. CT21More prairie-born ducks the farther south you go Globe
    14. CT22The canvasback pivot away from the Chesapeake See it
    15. CT23Game-farm mallard genes vs. wild Black Ducks

    Checked DT-Empirical Blend v2's scores, and Blend v1's before it, were re-run here from the lab's 918-day, row-by-row forecast file. The cross-tests above are still lab results, shown as patterns to test next.

    Oct 24, 2026 · DT-Empirical Blend v2 · current

    What changed in this model release

    DeltaTrax ships research in tested model chunks instead of small daily tweaks. Each one gets a new edition of this presentation, and this box records what changed. Flyway Model v1 was the beta. DT-Empirical Blend v1 was the first model under the DeltaTrax name. DT-Empirical Blend v2 is the second, and it goes into the DeltaTrax map at the same time.

    In DT-Empirical Blend v2

    • A new model. 23.6% fewer misses than the calendar over four unseen seasons, 9.7% fewer than Blend v1. See the replay
    • 12 new inputs. Snow cover, river flow, sustained wind, pressure drops and temperature contrasts. See what each one does
    • A cold wave, replayed in 3D. Dec 2023–Jan 2024 day by day: Blend v2 42% closer than the calendar, plus one winter it missed. Watch it
    • Wigeongrass vs. corn. Brackish wigeongrass units gave up 75.2% of the ducks on SC's public draw units. A 3D pocket finder shows why each spot made the map. See it
    • Pockets, pixel by pixel. Every 10-meter Sentinel-2 square inside five public cells: water, plants, mud. See it
    • The whole coast from the air. January 2026 flights from Delaware to Florida on one zoomable map. See it
    • Prime Hook, 52 winters. Dikes, breaches and restoration, from Delaware's survey flights. See it
    • Old rice fields, two outcomes. SCDNR bags by unit, and the rice-field history behind them. See it
    • January 2026 refuge counts. 13 Atlantic Coast refuges from the USFWS midwinter survey. See it

    Earlier · DT-Empirical Blend v1

    • DT-Doppler, in 3D. A regional migration outlook for the coast, with live NWS station readings. See it
    • Four new weather signals. Pressure surges, water temperature, dawn fog and rain intensity. See them
    • October 2026 on the globe. 423 public waterfowl sightings plus 11 satellite-tagged black ducks. See it
    • From the model to your map. How forecasts reach the DeltaTrax app, and how private data stays private. See it
    • Flyway Model v1 editions. The Flyway, Decoded: Where they're born on a 3D globe, the canvasback pivot, 52 Delaware Januaries in 3D, Mattamuskeet's 16 blinds and the 2026–27 counts.
    • Flyway Model v1's test. 12.0% better than the calendar on daily arrivals (p = 0.003).

    Terms & footnotes

    What every number means.

    Tap any small ? on the page to see its definition. Here they all are in one place.

    r (correlation)
    How tightly two things move together, from −1 to +1. 0 means no link. Here, most weather links run 0.1 to 0.4, which is normal when many other things also move ducks.
    p value
    The chance of seeing a link this strong if there were really none. Below 0.05 is the usual bar. Written like 4×10⁻⁵, which means 0.00004.
    q value
    A p value corrected for running many tests at once (Benjamini–Hochberg false discovery rate). It’s the tougher bar. 98 of 762 flyway tests passed q < 0.05.
    Calendar removed
    Each test first strips out normal season timing, so a link isn’t just “December is cold and ducks are south.” The calendar-only forecast is also the yardstick the models have to beat.
    Unseen years (out of sample)
    A model is trained on earlier seasons, then asked to predict later seasons it never saw. Only that score counts.
    Average error (MAE)
    Mean absolute error: how far off a forecast is on average. Lower is better. “12% better” means 12% less average error than the calendar.
    Late-season share
    Of each day's duck band reports from 17 eastern states (Florida left out), the share that came from divers and late-migrating dabblers. It climbs when the late birds arrive, so it's what DT-Empirical Blend v2 forecasts.
    Walk-forward test
    Train on every season before one, forecast that season, score it, then add it and step forward a year. Four steps here, 2020–21 to 2023–24, 554 days.
    Migration day alert
    DT-Doppler's flag for a big migration day: the late-season share landing in the top of its range, set from 2017–2021 only. Watch is the step below. Neither one picks a spot.
    May survey (WBPHS)
    The Waterfowl Breeding Population and Habitat Survey. Every May since 1955, USFWS and Canadian Wildlife Service pilots and ground crews count ducks and ponds along fixed lines. The "traditional survey area" covers Alaska, central and western Canada and the north-central U.S.
    Waterfowl Energy Day (WED)
    The food energy one duck needs for one day. SCDNR multiplies the food on each acre by its energy value and divides by a duck's daily need, so 1,000 WEDs can feed 1,000 ducks for a day or 10 ducks for 100 days.
    Log wind profile and roughness (z₀)
    Near the ground, wind speed grows with the logarithm of height. The roughness length z₀ sets how fast it slows toward the surface: tiny over open water (about 0.0002 m), larger over grass (about 0.03 m) and much larger over trees.
    Game-farm mallard
    Mallards bred in captivity and released, mostly for shooting preserves. They mix with wild mallards, and their offspring tend to migrate less and live closer to people.
    Habitat index (invite score)
    A 0–100 DeltaTrax rating for each satellite site, built from summer greenness, October water, summer growth that's now flooded and the change from last October. Cooper River's ricefields score highest in the Carolinas at 61.2. It rates habitat, not ducks, and a low October score can just mean a unit hasn't been flooded yet.
    Water reading (MNDWI)
    A satellite water index that compares green and shortwave-infrared light. Open water reads positive. Each site is read as a 2.8 km square (784 ha) at 10-meter pixels, with clouds and shadows masked out, and the four mapped impoundment cells are read inside their exact boundaries.
    Summer green (NDVI)
    A satellite plant index. Above 0.40 in August and September means lush growth, which is the food that gets flooded in fall.
    Band recovery
    A report of a banded duck, almost always shot by a hunter, sent to the USGS Bird Banding Lab with the date and place. It shows where ducks were shot and reported, not how many exist.
    Share
    The percentage of a group’s band reports that came from one region. Shares add up to 100% across the five regions, so one region going up means another went down.
    WMA and draw hunts
    Wildlife Management Areas. In SC, the coastal Category I WMAs are hunted by lottery on set mornings. The impoundments are rested between hunts, so they act as sanctuaries.
    Tidal coast vs. inland rivers
    On the tidal coast (ACE Basin, Santee Delta, Winyah Bay, Pamlico Sound), the tide rises and falls twice a day and impoundments sit behind trunks, so 14-day rain is the water signal. On non-tidal rivers like the Wateree, Congaree, Broad and upper Pee Dee, river stage is the signal, because high water spreads birds into flooded timber.
    River “normal”
    Today’s flow compared with the same calendar date in every year on record at that gauge. Normal is the middle half (25th to 75th percentile).
    Trunk, riser and spillway
    The water-control gates in an impoundment dike. Pulling boards drains a unit, and dropping them back in floods it. Most Carolina rice-field impoundments are run this way, so their water follows a plan, not just the rain.
    Impoundment
    A marsh closed off by dikes or roads, with gates that let managers hold water in or drain it out instead of leaving it to the tide. Run fresh, it grows seed plants like millet and wild rice. Run brackish, it grows wigeongrass. If the dike breaks, the tide decides.
    1st and 2nd split
    South Carolina's duck season runs in two parts with a short break in early December. Moist-soil units are usually flooded for the 1st split, and corn is held dry for the 2nd split in December and January.
    Homing and first-autumn ducks
    A homing (veteran) duck is recovered two or more winters after it was banded and tends to return to the same areas. A first-autumn duck is recovered the same season it was banded, on its first trip south.
    Block bootstrap
    A stricter p value. Weather today and tomorrow are linked, so neighboring days aren't fully independent tests. A block bootstrap reshuffles whole runs of days, 14-day blocks for the daily test, which keeps a model from getting credit twice for the same weather.
    NWI impoundment cell
    A wetland boundary mapped by the USFWS National Wetlands Inventory. An "h" in its code means diked or impounded. Reading inside that exact outline is more precise than a sample square.
    First model, Flyway Model v1, DT-Empirical Blend v1 and v2
    First model: the first try, forecasting WMA bags. Flyway Model v1: the beta, forecasting where ducks are along the coast. It beat the calendar on daily arrivals and still runs inside the Blend. DT-Empirical Blend v1: the first DeltaTrax model, Flyway Model v1 plus pressure surges, water temperature, dawn fog and rain. DT-Empirical Blend v2: the current model, Blend v1 plus snow cover, river flow, sustained wind, pressure drops and temperature contrasts. It runs DeltaTrax's forecasts and DT-Doppler.

    Sources & method

    Where every number comes from.

    Study data

    • Data pool total on the cover, 4,388,958 records: USGS banding 2,419,194 + airport weather 1,816,722 + NOAA daily climate and snow 75,999 + USGS daily river 72,735 + Delaware aerial flights 2,173 + SCDNR check-station entries 2,135. Smaller sets (refuge blind sheets, May survey tables, food census) aren't counted.
    • USGS Bird Banding Laboratory archive: 2,419,194 records (2,063,763 bandings and 355,431 recoveries) across 7 waterfowl groups in 16 Eastern states and DC, 1960–2024.
    • SCDNR Waterfowl Archive: 80 weekly and season-summary PDFs, 2021–22 to 2024–25, checked against the official 2024–25 season summary.
    • SCDNR public harvest records: 2,135 dated check-station entries, 2024–25 and 2025–26. Each row is one hunter, and the party size repeats on every row, so ducks per hunter is ducks divided by rows.
    • Iowa Environmental Mesonet ASOS: 1,816,722 hourly weather observations.
    • NOAA NCEI GHCNd: 75,999 daily climate and snow records.
    • USGS NWIS: 72,735 daily river stage and discharge records.
    • Copernicus Sentinel-2 L2A: scenes from summer 2026, October 6–21, 2026 and October 2025 for 27 wetlands, cloud and shadow masked.
    • MyWild summary of the SCDNR and USFWS Midwinter Aerial Waterfowl Survey, January 2026.
    • USGS instantaneous values and daily statistics: live flow at 17 river gauges in South and North Carolina, compared with every year on record for the same date.
    • Sentinel-2 scene S2B_17SPS_20261014 and S2C_18SUE_20261016: the image crops shown in the satellite section.

    Food, pockets & aerial counts

    Published research

    DT-Empirical Blend v2 and DT-Doppler

    Flyway Model v1 edition

    Also in this edition

    Flyway Model v1 lab files

    How it was checked

    • This edition's checks: Delaware totals were recounted from DNREC's raw file of 2,173 rows, and Mattamuskeet's from USFWS's three spreadsheets (1,913 hunters, matching the lab). The lab's Delaware "+308%" compared a 2024 flight of three zones with a 2026 flight of 11; like for like it's +212%. Mattamuskeet results are per hunter, not per gun. Canvasback numbers come from USFWS Table 11. The lab's breeding shares and its "691,000" are from 2025, and 2026 is 781,600.
    • Canvasback diet: the original paper says weight loss during fasting did not differ by diet. The lab's "21.5× worse, −86 g vs. −4 g" comes from a secondhand summary, so only the paper's gain rates are shown. The lab's exact continental shares for each wintering site mix fall stopover and winter counts, so towers are labeled by season instead.
    • Origins: the state gradient and species table are lab estimates, shown with that label. The lab's r = −0.94 and p < 10⁻¹⁵ aren't shown, because with 11 states the p value can't be that small. Weighting the lab's own species table by South Carolina's actual bag gives about 44% interior-born, not 65%. That's likely because band returns over-represent heavily banded prairie birds. That's why the globe calls it direction and rough size, and the re-run is first on the list.
    • Left out for now: the Florida and Georgia WMA series, Pamlico Point, Merritt Island's scaup crash and the 74-unit coast atlas's WED totals. They couldn't be matched to a public source yet. Also left out: the private plantation network and anything from personal hunt logs.
    • Earlier checks: Every new public number was read from the original report or paper. May survey values match the 1955–2024 average of 35.4 million and the 2025 and 2026 releases. The lab's crop "tillage index" isn't shown because it has no source.
    • Food census: Santee Coastal's 17,856,000 WEDs and 67.0% share match SCDNR's Table 7. The brief listed 4,000,000 WEDs for Yawkey, which isn't in the report, so it's left out. Ducks per hunter come from SCDNR's minutes, which report per hunter, not per gun.
    • Kinloch: the brief's monthly table and diet split didn't match the paper. For example, it gave wigeongrass 23.0% of the diet, and the paper says 29.8%. The chart uses the paper's Tables 1 and 2. The paper blames algae, not ducks, for most of the wigeongrass loss.
    • Mallards: the 89% figure is in the study's abstract. The brief's 1.16% mallard bag share and its species shares didn't match the 12,771-duck SCDNR atlas, so the atlas (2.5%) is used. Its band-origin shares (73.1% eastern) aren't shown because two lab files disagreed, for example Green-winged Teal at 88.9% vs. 96.2%.
    • Wind: the brief multiplied 10-meter wind by a ratio meant for 30 meters. The column uses the standard formula instead.
    • Lab notebook: the 29 hypotheses are called "laws" in the lab files. They're shown here as patterns under test, without p values, because several are rounded placeholders that can't be reproduced from the files. Where the lab's summary and its earlier cross-test file give different baselines for the same percentage, only the percentage is shown. The reported r = 0.88 holdout isn't shown as a score until its ledger is published. The Indian River Lagoon vs. Sapelo scaup comparison isn't shown because its counts couldn't be traced to a public survey.
    • Privacy: personal hunt logs, their 3D flight paths and named private spots are left out of this public page.
    • Flyway Model v1 checks: satellite values were read from the corrected Drive files and spot-checked against the raw Sentinel-2 scenes. An independent read matched within 3 points (Murphy Island 76.7% vs. 79.6%, Yawkey 52.1% vs. 53.9%, Hyde County 0.13% vs. 0.15%, Donnelley 0% vs. 0%). Last edition's satellite numbers, which had a double-applied offset and no cloud mask, are replaced.
    • Homing results come from the linked-pair Drive file. Where the release notes' species table differed from that file, the file was used, which is why the species chart shows a mixed pattern. Habitat index values also come from the file (some notes were off by about 1 point). The 52.8% Santee Coastal bag share wasn't shown because it couldn't be confirmed from the atlas.
    • Model p values re-run on Flyway Model v1's 1,170-row test record: daily MAE 0.0970 vs. 0.1103 for the calendar (−12.0%, 352 test days), Wilcoxon p = 4.4×10⁻⁸, 14-day block bootstrap p = 0.003. The two-week Carolina share is −7.4% on 54 periods (Wilcoxon one-sided p = 0.011) but doesn't clear the block bootstrap. Cedar Island's closure confirmed on SCDNR's lottery page.
    • The public model name is Flyway Model v1, built from the lab's files in the private DeltaTrax Data & Forecast Lab folder, October 22, 2026.
    • Flyway map shares recomputed straight from the banding records, not from the brief's rounded map table, which put the southern gain in South Carolina. The records put most of it in North Carolina.
    • Model results read from the evaluation tables: 352 test days and 54 test periods (the brief said 414 and 55). WMA results use the v2 table on 275 deduplicated weeks, replacing the first version's numbers.
    • Signals are shown at their real strength and tagged by tier. The Gadwall and wigeon pressure signal (r = +0.72, 20 weeks) is back as an early signal. Still left out: the 15.3% southwest-wind share and the −3.08 hPa figure (no supporting table), and the "ON vs. OFF year" map (each region picks its own years, so they can't be added up).
    • The hunting-season map and the weekly replay use hunter recoveries from November 16 to January 31 only. Species-level brief values were corrected to the table: Mallard p = 0.057 (not 0.039), Black Duck p = 0.026, Ruddy Duck p = 0.0004.
    • Moon effects are cited to the published Arkansas study, not to DeltaTrax data. Gunfire flush, sheetwater thresholds and leeward-bank behavior are labeled field rules.
    • Original synthesis by Gemini for the DeltaTrax Data & Forecast Lab. Verification and presentation by WDG Consulting.